Community and public foundations provided 31% of all funding
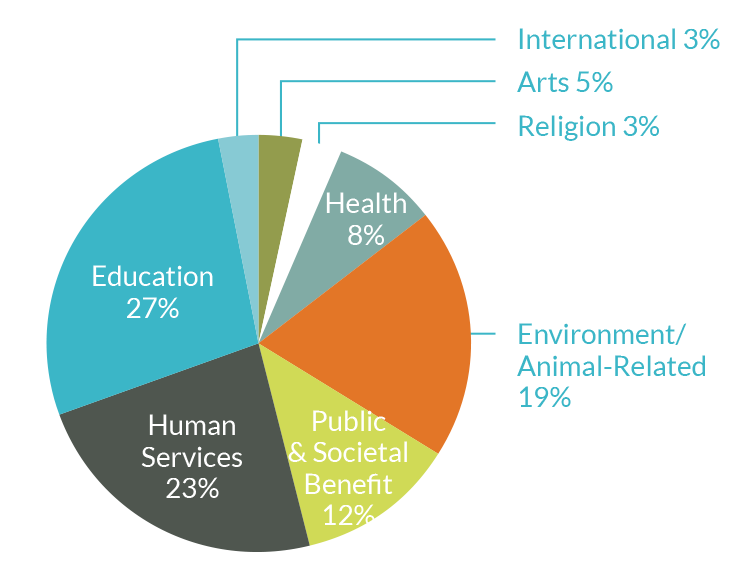
Community and public foundations play an important role in the health of Montana’s nonprofit ecosystem – contributing nearly $10 million to the state in 2012. This represented a 56% increase over community and public foundation giving in 2010. Despite these gains, overall giving to the state was down by $21 million. This trend was predominantly driven by a 72% decline in support to environmental initiatives (-$13 million) by funders outside of the state. Montana typically has a comparatively high proportion of funds allocated to environment and animal-related issues. In 2012, over $6 million (19% of all state funds) was contributed to the category. It’s also important to note that 50% of all giving within the human services category ($3.7 million) went to recreation initiatives that also had environmental conservation priorities. Distributions from the Whitefish Community Foundation for trail easements accounted for a significant portion of this finding.
 Total giving by 68 organizations: $31,734,040
Median grant: $5,000
Number of grants: 1,177
Change in giving from 2010: - 48%
Top 10 Grantmakers to Montana, 2012
- Whitefish Community Foundation (MT)
- Gianforte Family Charitable Trust (MT)
- M. J. Murdock Charitable Trust (WA)
- Dennis and Phyllis Washington Foundation (MT)
- Montana Community Foundation (MT)
- Gilhousen Family Foundation (MT)
- Student Assistance Foundation of Montana (MT)
- Wilburforce Foundation (WA)
- The Community Foundation for Greater Atlanta (GA)
- National Fish & Wildlife Foundation (DC)
Giving to Montana by Subject Area & Subcategory
| Subject & Subcategory | Total Grants | % of Subject Area & Total |
| Arts | $ 1,593,195 | 5.02% |
| Arts & Culture | $ 156,008 | 9.79% |
| Arts Support & Services | $ 420,152 | 26.37% |
| Historical Societies & Historical Preservation | $ 114,900 | 7.21% |
| Humanities | $ 30,000 | 1.88% |
| Media & Communications | $ 49,500 | 3.11% |
| Museums | $ 468,885 | 29.43% |
| Performing Arts | $ 301,250 | 18.91% |
| Visual Arts | $ 52,500 | 3.30% |
| Education | $ 8,650,776 | 27.26% |
| Adult Education | $ 21,900 | 0.25% |
| Alliances, Advocacy & Policy Analysis | $ 6,000 | 0.07% |
| Colleges & Universities, Graduate & Professional Schools | $ 5,718,354 | 66.10% |
| Early Childhood Education | $ 25,000 | 0.29% |
| Education Support & Services | $ 819,099 | 9.47% |
| Elementary & Secondary Schools | $ 1,833,099 | 21.19% |
| Libraries | $ 35,500 | 0.41% |
| Two-Year Colleges, Vocational & Technical Schools | $ 191,824 | 2.22% |
| Environment/Animal-Related | $ 6,058,259 | 19.09% |
| Alliances, Advocacy & Policy Analysis | $ 189,300 | 3.12% |
| Animal Protection & Welfare | $ 23,838 | 0.39% |
| Botanical Gardens, Arboreta, Horticulture | $ 4,500 | 0.07% |
| Environment & Animal Support | $ 464,500 | 7.67% |
| Environmental Education | $ 287,729 | 4.75% |
| Pollution Abatement & Control, Recycling | $ 90,473 | 1.49% |
| Sustainable Urban or Rural Economic Development | $ 740,500 | 12.22% |
| Wildlife & Natural Resource Protection & Conservation | $ 4,257,418 | 70.27% |
| Health | $ 2,548,921 | 8.03% |
| Ambulatory & Primary Health Care | $ 343,250 | 13.47% |
| Cancer Treatment, Support & Research | $ 22,000 | 0.86% |
| General Health Support & Financing | $ 35,400 | 1.39% |
| Hospitals & Health Systems | $ 985,000 | 38.64% |
| Medical Research | $ 15,000 | 0.59% |
| Mental Health & Crisis Intervention | $ 558,500 | 21.91% |
| Public Health | $ 346,000 | 13.57% |
| Rehabilitative Care | $ 111,771 | 4.39% |
| Reproductive Health Care | $ 20,000 | 0.78% |
| Specific Diseases (Treatment & Prevention) | $ 112,000 | 4.39% |
| Human Services | $ 7,374,403 | 23.24% |
| Alliances, Advocacy & Policy Analysis | $ 280,000 | 3.80% |
| Centers | $ 117,851 | 1.60% |
| Children & Youth Services | $ 213,000 | 2.89% |
| Crime, Justice & Legal Services | $ 381,000 | 5.17% |
| Emergency Assistance | $ 18,500 | 0.25% |
| Employment/Jobs | $ 10,000 | 0.14% |
| Family Services | $ 233,700 | 3.17% |
| Food, Agriculture & Nutrition | $ 311,636 | 4.23% |
| Housing & Shelter | $ 349,170 | 4.73% |
| Human Services Support | $ 310,735 | 4.21% |
| Multipurpose | $ 289,600 | 3.93% |
| Personal Social Services | $ 153,500 | 2.08% |
| Public Safety, Disaster Preparedness & Relief | $ 5,000 | 0.07% |
| Recreation & Sports | $ 3,416,671 | 46.33% |
| Residential Care & Adult Day Programs | $ 33,500 | 0.45% |
| Youth Development | $ 1,250,540 | 16.96% |
| International | $ 788,485 | 2.48% |
| Christianity | $ 26,600 | 3.37% |
| Foreign Affairs & National Security | $ 13,000 | 1.65% |
| Human Rights | $ 600,000 | 76.10% |
| International Development | $ 87,885 | 11.15% |
| International Health | $ 1,000 | 0.13% |
| Promotion of International Understanding | $ 60,000 | 7.61% |
| Public & Societal Benefit | $ 3,884,201 | 12.24% |
| Alliances, Advocacy & Policy Analysis | $ 150,000 | 3.86% |
| Civil Rights, Social Action & Advocacy | $ 362,335 | 9.33% |
| Community Improvement & Capacity Building | $ 70,422 | 1.81% |
| Economic Development | $ 1,296,093 | 33.37% |
| Financial Institutions | $ 100,000 | 2.57% |
| Government & Public Administration | $ 932,425 | 24.01% |
| Leadership Development | $ 48,600 | 1.25% |
| Military & Veterans Organizations | $ 24,747 | 0.64% |
| Nonprofit Management | $ 89,500 | 2.30% |
| Philanthropy, Voluntarism & Grantmaking Foundations | $ 426,000 | 10.97% |
| Public & Societal Benefit | $ 138,369 | 3.56% |
| Public Policy Research | $ 153,180 | 3.94% |
| Public Safety, Disaster Preparedness & Relief | $ 2,000 | 0.05% |
| Science & Technology | $ 42,500 | 1.09% |
| Social Science | $ 6,030 | 0.16% |
| Voter Education | $ 42,000 | 1.08% |
| Religion | $ 811,691 | 2.56% |
| Christianity | $ 751,545 | 92.59% |
| Interfaith Coalitions | $ 18,146 | 2.24% |
| Religion-related | $ 42,000 | 5.17% |
| Unknown | $ 24,109 | 0.08% |
| Unknown | $ 24,109 | |
| Total | $ 31,734,039 |